In my last article, we discussed how to identify WR regression. If you missed it, you can find it here. We got such good feedback that we will be releasing a series of articles specific to each position. In fantasy football, you must be ahead of the curve. Identifying running back (RB) regression via metrics and league changes is an important aspect of the fantasy football game.
I will focus on the Running Back position here. They have metrics different from those discussed in the WR article. Here is a quick list of things you should be looking at to determine if a running back will regress to the mean positively or negatively.

MORE SGPN FANTASY FOOTBALL CONTENT
SGPN Fantasy Football Draft Cheat Sheets
SGPN Fantasy Football Projections
2022 SGPN Fantasy Football Draft Kit
SGPN Fantasy Football Rankings
Running Back Regression in Fantasy Football
Running Back Regression Metrics
Yards Before Contact (YBC) – yards gained before first contact
Yards After Contact (YAC) – yards gained after first contact
% of 8 Men in the Box – % of run plays where the runner sees eight or more defenders in the box
Attempts per Broken Tackle – how often a player breaks tackles (a simple metric for elusiveness and should be paired with YAC to validate)
Target Share and Vacated Targets – This is especially important for PPR leagues
TD Efficiency – How many touches per TD (NFL Average is 1 TD every 31 touches or every 133 yards)
(To better understand how TDs are affected from year to year, read another SGPN Article, “Red Zone Analytics and Takes.”
NOTE
I will always recommend not using only one path to determine a player’s values. Many other things affect decisions regarding acquiring or selling assets on your dynasty team. We will explore some of these in this article, but others will not. They include but are not limited to coaching changes, offensive line changes, contract status, and projected game scripts. I will not mention whether you should trade for or away but instead suggest combining this analysis with the items mentioned above to determine if you are in a position to obtain these players.
We can use an example where I believe the regression is steady and unlikely to change based on a variety of factors. This example can help show you how hard it is to fully project running back regression.

Najee Harris – Pittsburgh Steelers
Regression Assessment: Steady
ADP: RB2 in Dynasty, RB5 in Redraft
Recent Dynasty Trades: Aaron Jones and a 1st, Rhamondre Stevenson and two firsts, Dalvin Cook and Jahan Dotson
Basis
He is a popular candidate for regression. I don’t totally buy it, though. Yes, he had 307 carries and 94 targets which led the league, but he only combined for 10 TDs. Following our averages, he should have had around 14 TDs based on carries or 13 TDs based on yardage. Even when he sees a reduction in carries and targets (which is highly likely), the TD efficiency, one would hope, returns to the mean. The only concern I have with that is the putrid offensive line. Even with that, he managed a good ratio of created yards and is top 10 at breaking tackles.

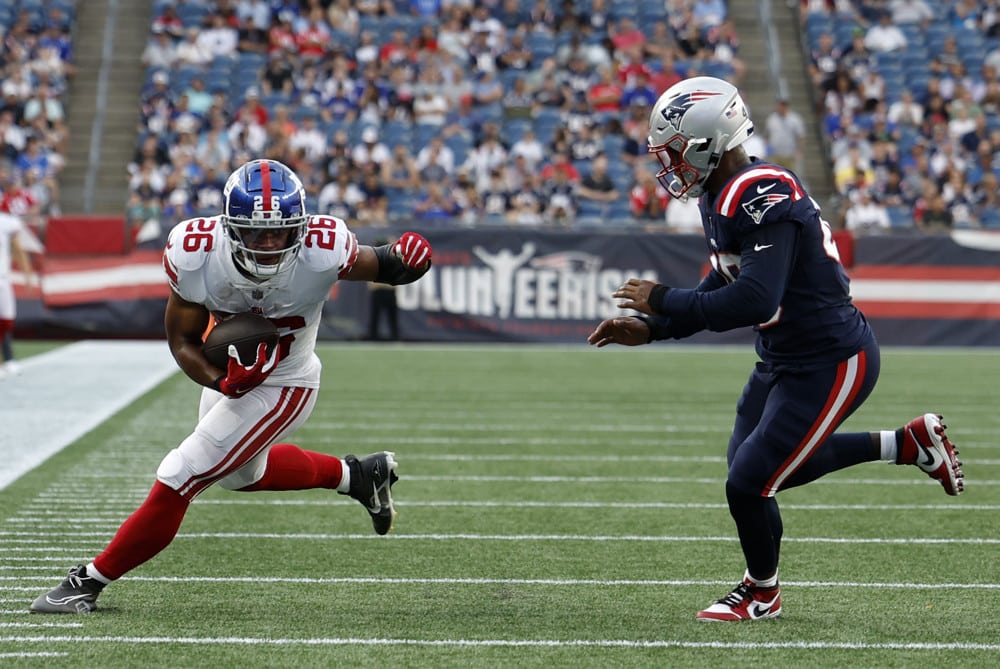
Rhamondre Stevenson – New England Patriots
Regression Assessment: Positive Candidate
ADP: RB38 in Dynasty, RB36 in Redraft
Recent Dynasty Trades: David Njoku and a 2nd, 2nd round pick plus WR4
Basis
With all the hype around Stevenson right now, it’s easy to get caught up in the storm. So let the metrics help you. Not only are you looking at a situation where Brandon Bolden and James White are gone (49 targets to the RB position up for grabs), but you are also looking at the best metrics among all running backs in the YAC/YBC metric and attempts per broken tackle, meaning he created more of his total yardage than any other back.
Coupled with that, he saw the second most rushing attempts against stacked boxes. He just looked the part; now, with the conversation of him getting more opportunities, he has to take a step in the right direction.
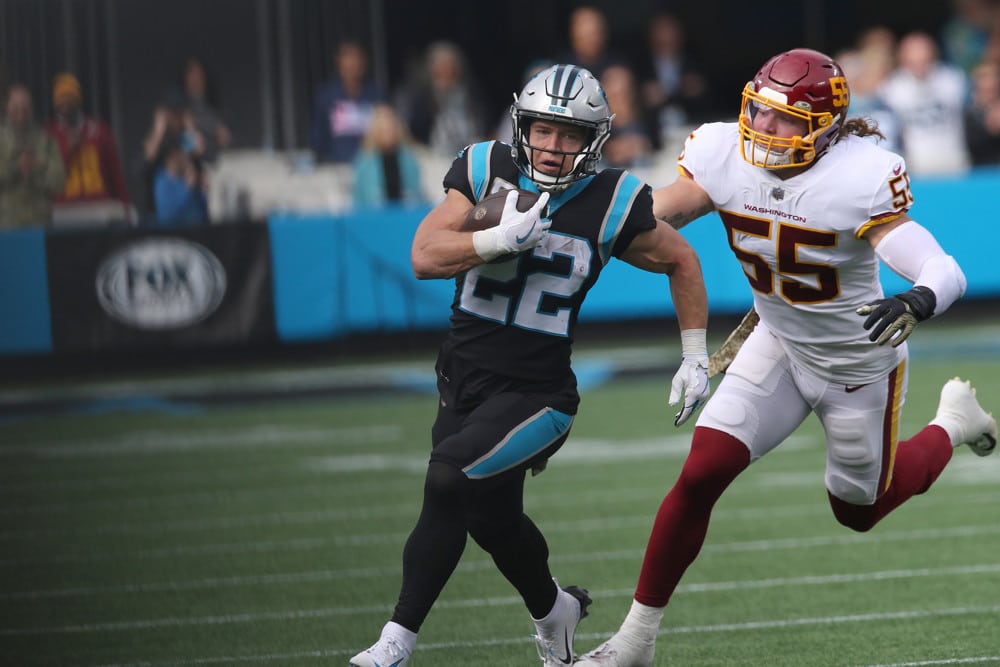
Saquon Barkley – New York Giants
Regression Assessment: Positive Candidate
ADP: RB12 in Dynasty, RB14 in Redraft
Recent Dynasty Trades: Two 2023 1sts, Clyde Edwards-Helair and Jameson Williams, Chase Claypool / Brandon Aiyuk and a 2nd, Tony Pollard and four 2nd’s
Basis
The metrics are way down on Barkley right now. His metric of YAC/YBC is below one, his broken tackles were way down, and he has often been injured. All those things indicate bad things for Barkley. However, if we use the same methodology as prior and say he has to regress to the mean, that is a positive for Barkley.
Other factors included in this assessment are the fact that his averages before injuries were off the charts, his targets were in the elite category, and he now has a coach that has been top 10 in rushing offense for five of eight seasons as an OC in both attempts and yardage. Those, along with the simplicity of averages, say he has to improve.
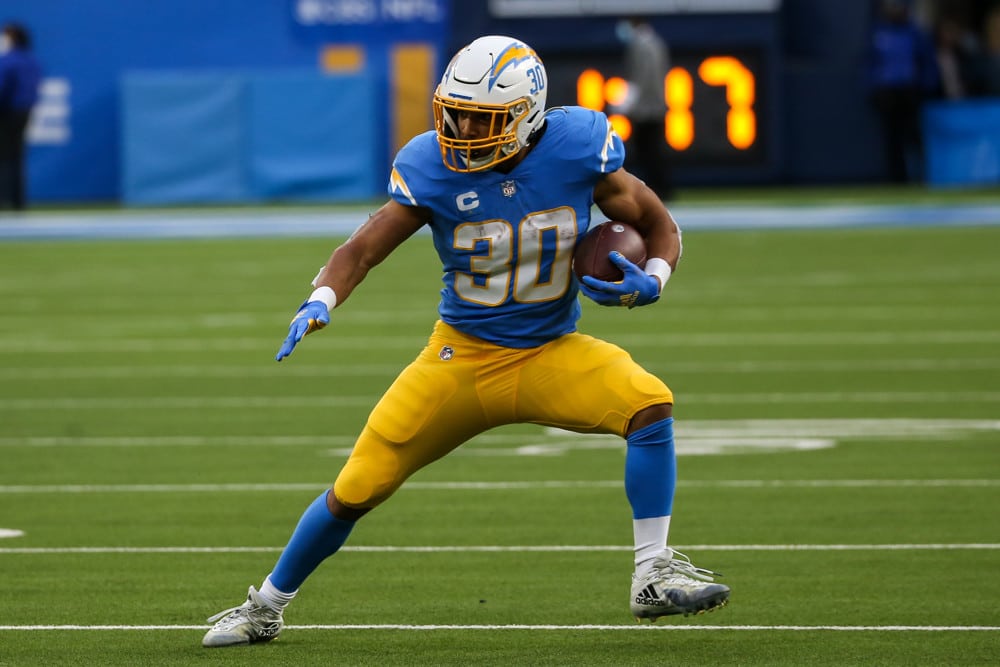
Austin Ekeler – Los Angeles Chargers
Regression Assessment: Negative Candidate
ADP: RB6 in Dynasty, RB2 in Redraft
Recent Dynasty Trades: CeeDee Lamb and a 1st, Jerry Jeudy and a 1st, Allen Lazard and two 1sts
Basis
Look, Austin Ekeler is a stud, and no one can argue against that. He has averaged over six targets a game over the last three seasons, almost 4.5 YPC, and is in the second year of the system that made him the RB2 overall last season in what, in any other year, would have been an RB1 overall finish (thank you, Jonathan Taylor). It did, however, require 20 TDs to do that on only 276 touches. That is a TD every 14 carries. That is insanely impressive.
Now we add in a serviceable TE in Gerald Everett, another year with Mike Williams as the alpha he proved he could be when healthy, and the biggest factor, in my opinion, Isaiah Spiller. He will for sure see less than 200 carries and may still touch the 90 target mark in an offense that wants to air it out.
James Connor – Arizona Cardinals
Regression Assessment: Negative Candidate
ADP: RB24 in Dynasty, RB17 in Redraft
Basis
RB5 overall! James Conner was RB5 overall in PPR leagues last season. He produced these numbers while averaging a mere 3.72 yards per carry with a measly 37 receptions. His TD efficiency numbers were off the charts as he nearly tripled his expected TD totals, the second highest of the season next to Boston Scott, which is crazy in itself.
I would expect, however, that he sees more work in the passing game with the loss of Chase Edmonds to the Miami Dolphins and DeAndre Hopkins for what looks like the first six games of the season. If you remember, when he was a Steeler, he did have a season with 71 targets and looked good with them. I just don’t expect the TD efficiency to be there again.
So What Now?
Take a look at our trade value chart and rankings, then look at your team. Based on your current team build and projections, use the information we provide here at SGPN to decide whether you should buy or sell these players at their current value based on the projected regression. Now, let’s go dominate!