For anyone who has been a part of the Gambling Twitter universe for even a week, you know that gambling touts giving out their “10U Max Bomb Plays of the Month” are a dime a dozen.
If you are like most of us, I’m sure you’ve found a person or three that you follow who’s gotten hot and you’ve gone all-in on studying their twitter patterns and posts. You’ve likely blindly tailed their picks for a few days, if not weeks, and after seeing your financial capital jump up and down like an EKG during a heart attack, I am sure you are surprised to see that all these bets aren’t hitting at the advertised 75+% win rate.
You’ll really know that you’ve hit rock bottom when you find yourself paying someone up front to get access to their picks, and then paying your bookie on the back end when the picks that you paid for don’t win. You find yourself saying, “I’m done with this, let me figure out how to make some smart decisions on my own!” However, where are you supposed to start?
Okay, that’s enough about my life story, let’s dive in deep to the gnitty-gritty details on how you can create an NBA Model. Hint: if you are still in that rock-bottom step, bail out as quickly as you can!
Ground Rules
Before we start let’s make sure we lay out the ground rules. First off, you do not have to be an expert computer coder to make a model (although you do need to be well-versed in Excel). I personally don’t know a single computer language other than “hunt-and-peck” and I’ve managed to create quite a few different models across multiple sports.
Second, there is no set definition or requirement for a successful model. It can be as simple as a tool you use to quickly compare 3 to 5 key stats every night, or it can be an in-depth predictive output model that creates it’s own stat categories. The important part is that you keep tinkering with it until you see start to see results that you like.
Last but not least, let’s make sure that the model is mainly driven off of statistics and numbers (leave out jersey colors, days of the week, relative proximity to the ocean, current moon phase, etc…) and that we are focusing on using numbers that we know rather than using numbers that we think we can predict.
Scraping for Data & Analyzing
This last point was a very crucial one for me when I was creating my NBA Over/Unders model. I started out by downloading every possible team statistic from the first two months of NBA games this season.
I went through and calculated Effective Field Goal Percentage (eFG%), Possessions (Poss), Pace, Offensive Rating (ORtg), Defensive Rating (DRtg), and a multitude of other stats for each game. At first, I started down the path of “In games where the score was ___, what was the eFG%, ORtg, Etc?” and tried to find strong correlations.
However, I quickly realized that by using this type of analysis, I wouldn’t be able to properly use a statistic that I knew (eFG%) to predict a stat that I didn’t know (Total Score). Instead, I had to reverse it and ask “In games where the eFG% was ___, what was the Total Score?”
I want to emphasize how important that step is when reviewing the breakdown of a statistical model. Focus on the stuff you know, and then find out how well that can correlate and predict stuff you don’t know…not the other way around!
Effective Field Goal Percentage
If you are still following along with me at this point of the article, prepare yourself because we are about to dive all the way in!
Let’s keep going down the path of effective FG%. This season, all 30 NBA teams have an Offensive eFG% between 49% to 56%. This range is almost identical on the Defensive side of the ball as well.
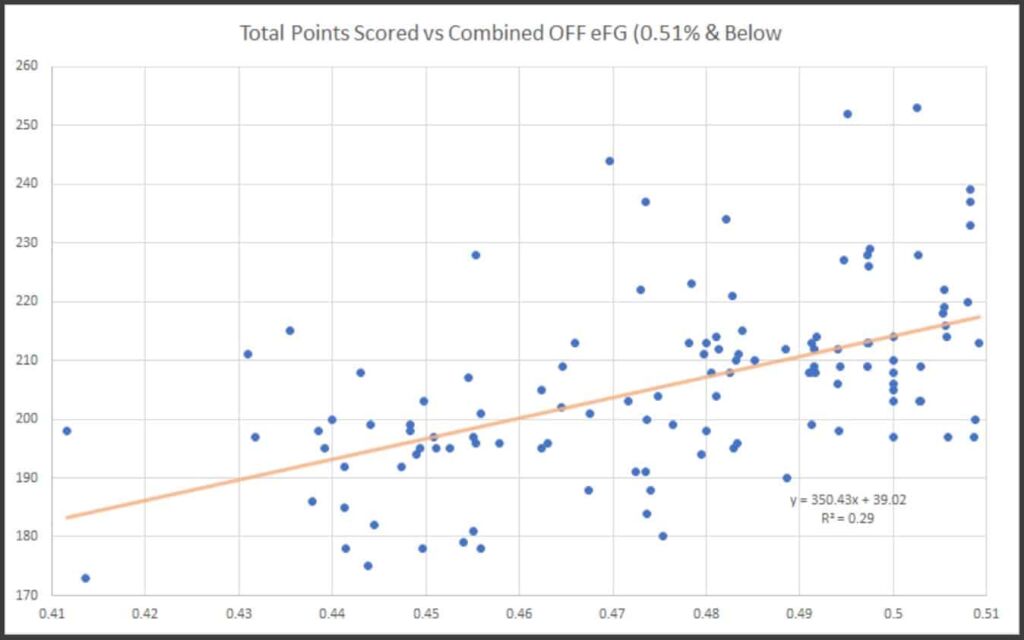
Let’s use last night’s matchup between Minnesota (51% eFG) and Charlotte (50.3% eFG) as an example. When we average these two together, we get an expected combined eFG of 50.7%. When we look at what the Total Points scored have been in games this year where the combined eFG% was less than 51% here’s what we see.
As you can see, by using this scatter plot we are able to have Excel give us a trendline for the data and an R-squared value (how much variance is in this data). In a perfect world, an R-squared of 1 means your trendline has no variance and 0 means that there is no correlation at all.
In the sports gambling world, I don’t think you will find anything above 0.5, so the 0.29 value that this data is pumping out is pretty good! We can use the trendline to put our data to the test: 350.43x(0.507 eFG%) + 39.02 = 217 Total Points with an R-Squared of 29%. If we use the same process for the Defensive eFG values for Minnesota & Charlotte, we get an output of 227 Total Points & an R-Squared of 5%. It’s important to keep track of our different R-squared values for each of these steps since we will use them to create a weighted average at the end.
Pace/Possessions
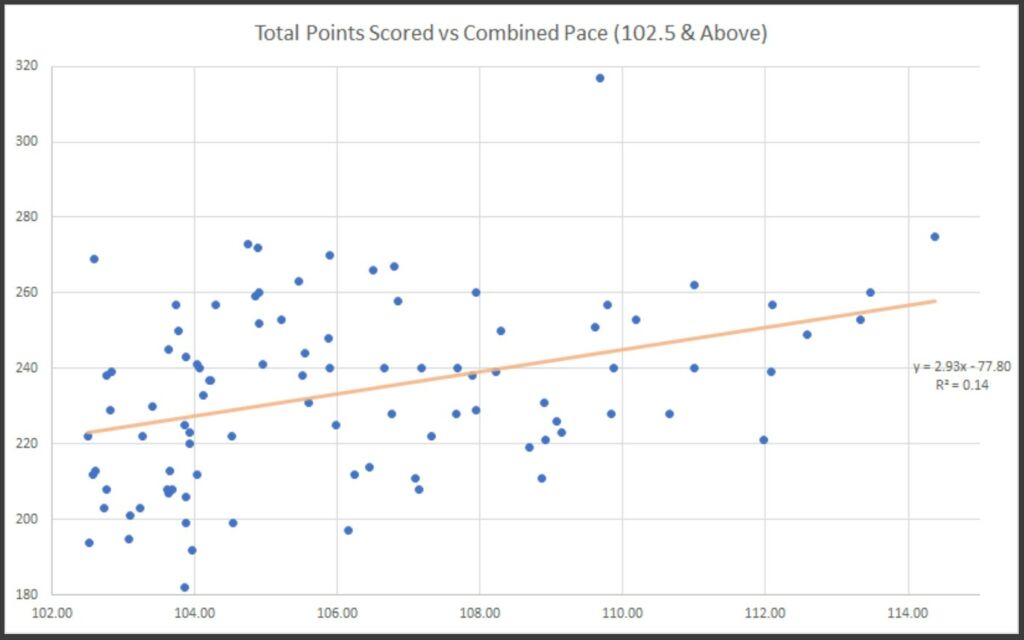
The next thing we will look at after eFG% is Pace/Possessions. Using an identical process as above we see that Charlotte is the slowest in the league (96.3) while Minnesota plays at a Top 10 pace (102.7). By averaging these together we get an expected pace of 99.5 for this matchup. Now a word of caution, Pace is the variable with the lowest correlation in my model. Below, I have included an example of what the data set with the highest R-Value (Games w/ a combined pace above 102.5) looks like. For our example of 99.5, the trendline pops out as 0.93x(99.5 Pace) + 127.48 = 220 Total Points and an R-Squared of only 1%.
Offensive & Defensive Rating
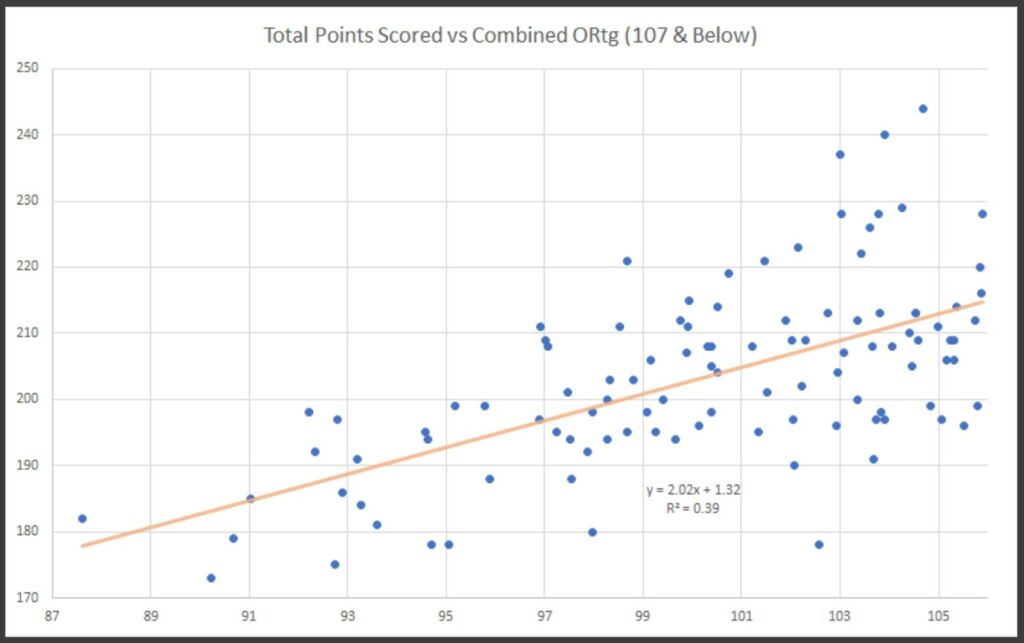
Lastly, we will plug in the Offensive & Defensive Ratings into the model. On the Offensive side, Charlotte (105.8) & Minnesota (107.8) are both in the Bottom 10 of the league and they average out to an expected combined ORtg of 106.8. In games where the ORtg is below 107, we have a high R-Squared value and a trendline which spits out 2.02x(106.8 ORtg) +1.32 = 217 Total Points (R-Squared of 39%). Using the DRtg numbers we see an output of 226 Total Points and an R-Squared of 28%.
Summary & Weighted Averages
Now that we’ve worked through all the numbers mumbo jumbo (aka the hard stuff to effectively explain in an article), we can now put everything together. Here’s the matrix I created that helps compile all the information into one place.
As you can see the weighted average of the Offensive Factors is 216.9 Total Points while the Defensive Factors is showing 226.2 Total Points. If we then take a weighted average of both, we get an expected value of 219.9 Total Points for this matchup based on Minnesota & Charlottes eFG%, Pace, ORtg, and DRtg season averages.
Last night, Las Vegas set the Over/Under at 228 for this game (it did take a dive down to 225 after the Karl Anthony Towns news hit before tip off, but we will use 228 since that’s what I got it at on Twitter yesterday morning). After a little trial and error, I have settled on a 6-point delta being the tipping point on whether I should take the Over or the Under in a game. In this case, since the delta between Vegas and my model was just over 8 points, this was a recommended Under play and it was a winner after Charlotte won 115-108 last night! Hopefully you were able to get a number closer to the opening line of 228 and didn’t have to sweat as much.
Results & Success Rate
Well there we have it, I think we ran through just about everything. The last thing we need to touch on is the success rate of this model. Last night, the model went a whopping 5-0 (rare, but huge!) which brings us to 21-12 over the last 7 days. So far this season, Over recommendations are 60-41-2 (59.4%) while Under recommendations are 50-52-2 (49.1%) for a combined record of 110-93-4 (54.2%). I generally post the plays for the day on my Twitter feed between 12-3pm PST, so be on the look out for those. If you have a model of your own or want to bounce ideas around with me please don’t hesitate to reach out and we can dig into the data together!


