Placing wagers on the first half, a given quarter or live betting the over/under can make even a miserable game more exciting, It’s also a viable way to either concentrate or hedge game totals. But how can you tell when those points are likely to come in?
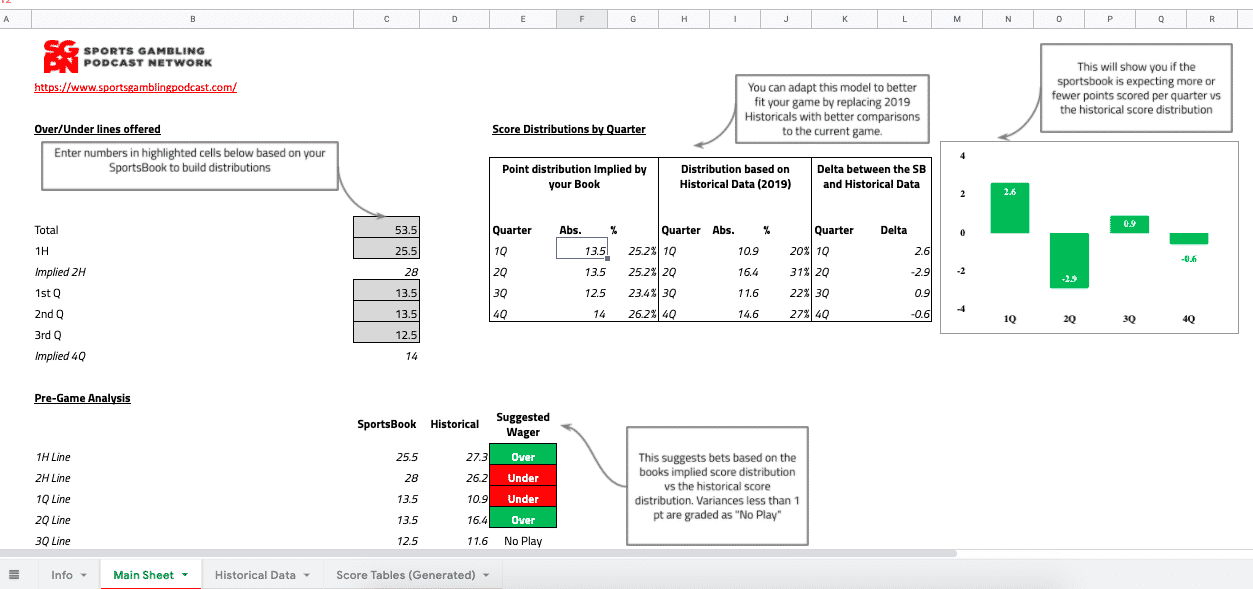
This downloadable Excel spreadsheet compares over/under lines vs a historical distribution. With a few simple inputs, it helps you determine if the quarter, half-game and live lines offered by your book are good bets.
All formulas are unlocked and the sheet is fully customizable. You can build in your own scoring distribution and customize this to the game you’re handicapping.
If you have any questions on using this sheet or have any suggestions for added features or other tools you would like to see hit me up on SGPN Slack (@GoBearkats) by signing up here.


