They say curiosity kills the cat but let this be a warning for bloggers too. This project is as much an homage to my own masochistic-curiosity as it is about NBA data analytics. Somehow, I thought it would be fun to see if I could use my data science “skills” to determine the NBA’s single Most Valuable Statistic.
I spent nearly every free moment over the past two quarantine-weeks trying to figure it out. The endless hours tinkering with spreadsheets left me dead inside and my absurd caffeine intake has ravaged my stash of toilet paper… but the hardest part has been ducking Tiger King spoilers like I’m Ben Stiller and the Globo-Gym Purple Cobras.
What does the “Most Valuable Statistic” mean?
Well, as Vince Lombardi said, “Winning isn’t everything, it’s the only thing.” So whichever statistic best correlates to winning should be considered the most valuable. Specifically, this analysis looks at how various Team Statistics relate to Team Win % and attempt to pinpoint a single stat that best translates into winning games.
RELATED
My NBA Reddit Post That Went Viral: James Harden’s Road Play with City’s Strip Club Quality Analysis
Charles Barkley’s Secret: A Critical Analysis
Pulling the Data
I assembled every team statistic I could find for the past 20 NBA Seasons into one spreadsheet – Traditional box stats, Advanced Stats, Dean Oliver’s Four Factor stats, miscellaneous stats, scoring stats, playoff seeding, etc. I merged together hundreds of individual data sets from basketball-reference, Wikipedia and NBA.com to create a single, comprehensive database of Team Statistics.
This spreadsheet has more than 70 data points for every NBA team going back to 1999. Everything from a Team’s “Number of Players on All-Defense” to the “Percent of 2-Point Field Goals Made Unassisted” – this spreadsheet has it all.
And I thought spending a couple hours googling strip club locations and churro venders was rough…
Imagine having to download hundreds of data tables, cleaning them up, and then joining them together with tedious index-match formulas that have to be checked three times over… all without even the simple joy of picturing James Harden getting freaky at Pumps the night before dropping 44 on the Nets… ugh. Anyways, it was grueling.
But once all the data was compiled, the real nightmare began.
Preliminary Analysis – Basic Correlation to Win %
For each of the 70+ statistical categories, I ran a basic correlation analysis against Win %. Correlation simply tells us how two things relate to each other.
For this analysis, we are most interested in the relationship between Win % and the various Team Stats. We want to see if an increase in a stat coincides with an increase in Win % (and vice-versa).
Click on any image to enlarge
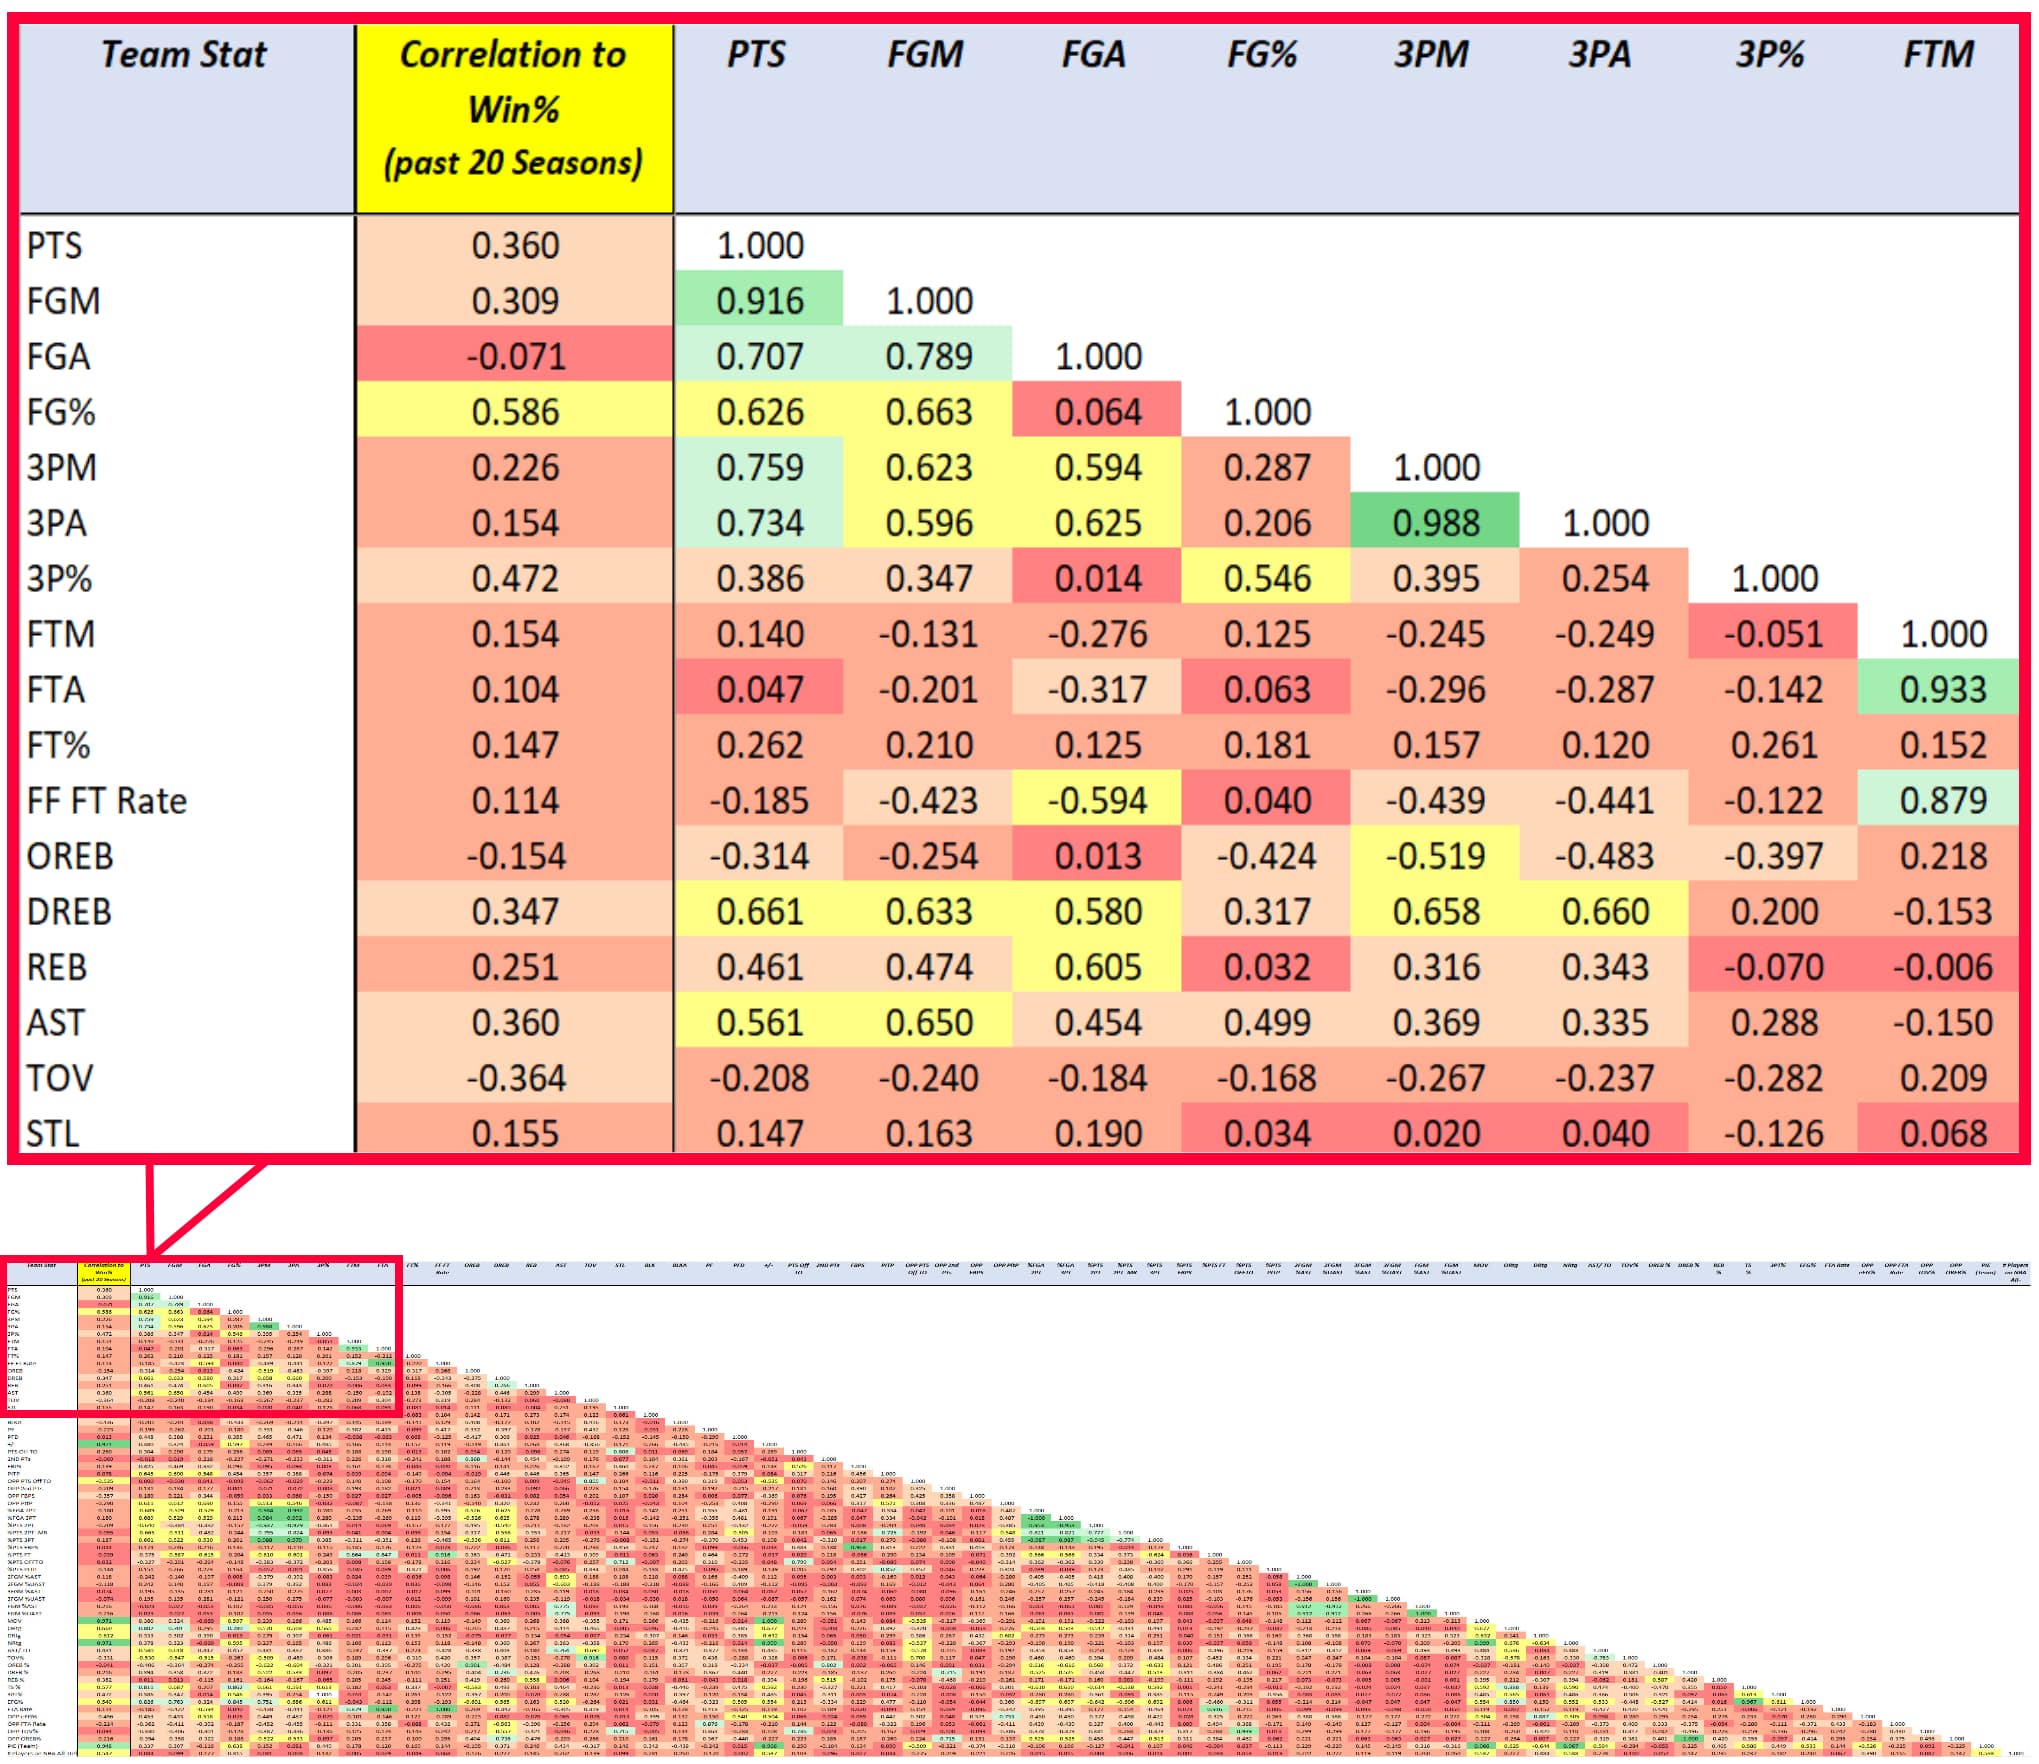
Here is what that initial correlation analysis looks like. While we are primarily looking at the highlighted column to the left, the other fields can provide insight into the relationships between the other team stats as well.
To help illustrate what “correlation” means, here is a visualization of a strong, moderate and weak correlation from the heat-map above:
Click on any image to enlarge

Note: each plot point on the charts represents a team’s stat rating & win % across the different years. There are 595 dots – one for each NBA team, for each of the past 20 seasons (29 teams until 2004).
The chart on the left depicts a very strong correlation – as a team’s PIE rating increases, their Win % increases. You may also notice how all the dots are tightly clustered along nice sloping line. Conversely, the Points in the Paint chart on the right looks like Daryl Morey’s ironic attempt at modern art.
The key from this step is simpler than it seems: identify the individual statistics with strong correlations to Win %. But as you can see, most stats by themselves, have a weak correlation!
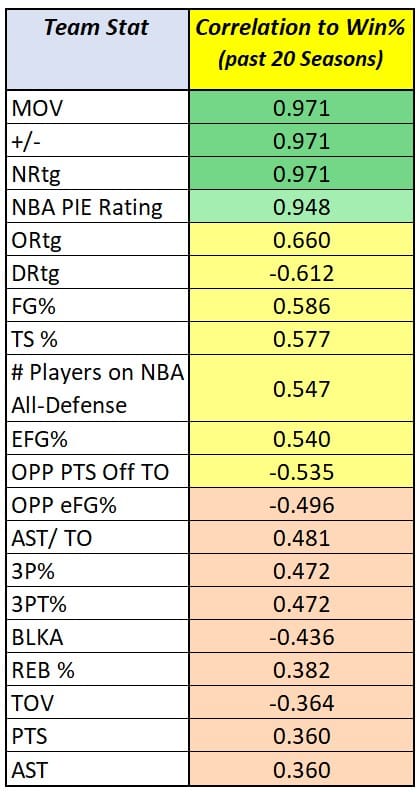
Initially, I identified only 20 Team Statistics with meaningful relationships to Team Win %:
However, three of these stats, despite their nice correlation, provide very minimal basketball insight:
- Plus/Minus simply measures a Team’s point differential
- Margin of Victory is literally just Plus/Minus with a fancy name (MOV is from basketball-reference; +/- is from NBA.com)
- Net Rating (Off Rating – Def Rating) is just the team’s +/- stat, adjusted per 100 Possessions.
So, what can stats like Plus/Minus or MOV even tell us? They don’t measure shooting efficiency or rebounding performance. They don’t measure ball security or defensive ability. Their strong correlation is based on only two numbers: Points Scored and Opponent Points Scored. The purpose of data analytics isn’t just discovering and interpreting data trends. Ultimately, the goal is to inform decision-making.
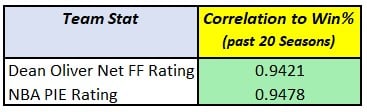
Coaches and GMs cannot be informed by stats like MOV because they have no tangible relation to how the game is played. Compared to the NBA-developed advanced stat, PIE, which is a formulaic combination of real box stats like FG, DREB, AST, TOs, PFs, etc. As the underlying team stats fluctuate, the Team PIE Rating fluctuates. These fluctuations allow decision-makers (coaches/GMs) to identify how changes in game style or performance or personnel impact the Team’s chances of winning.
With a correlation coefficient of .948, the NBA’s Team PIE Rating is the benchmark to beat.
Further Analysis – Dean Oliver’s Four Factors
I discovered the Four Factors of Basketball Success in a late-night, caffeinated nicotine-haze as I was extracting data from basketball-reference. I’d never heard of the Four Factors before and I did not know they were the brainchild of the godfather of basketball analytics – Dean Oliver, esteemed sports statistician and assistant coach to the Washington Wizards – in his attempt to answer the question, “How do basketball teams win games?” Now, I don’t know Dean personally, but I can attest to how much he hated himself in the middle of that discovery.
“There are four factors of an offense or defense that define its efficiency: shooting percentage, turnover rate, offensive rebounding percentage, and getting to the foul line. Striving to control those factors leads to a more successful team.” (Dean Oliver, Basketball on Paper)
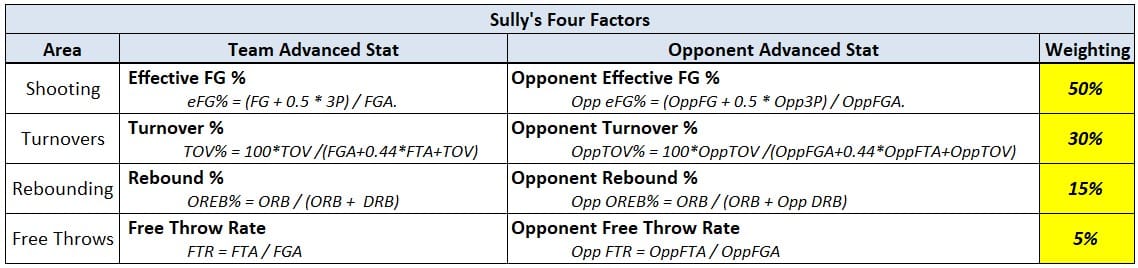
Oliver’s analysis established four general areas crucial to winning basketball games: Shooting, Turnovers, Rebounding and Free Throws. He assigned each of the four areas an Advanced Statistic and weighted them by their importance for success.
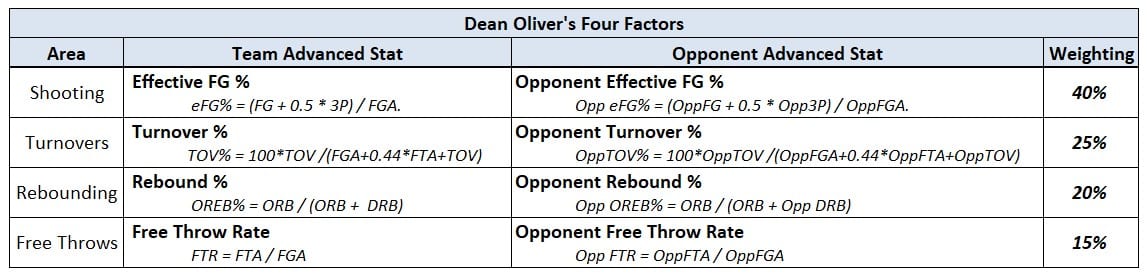
As you may have noticed, the name Four Factors is a bit of a misnomer! There are actually 8 factors to consider – four for the Team and four for the Opponent.
One thing that puzzled me: looking back at my initial correlation analysis, none of the individual factors have a strong relationship to Win %. Which means, in order to glean any meaningful insight into how they contribute to Team success, Dean Oliver’s factors must be analyzed together.

While Oliver has published his assigned weights for each of the factors individually, I couldn’t find any cases where he merged those separate factors into a single formula. So I did!
Using a sophisticated analytics system known as Trial and Error, I stumbled onto the following formula:
Dean Oliver Team Four Factor Rating = ((0.4*eFG%)-(0.25*TOV)+(0.2*OREB)+(0.15*FTR))
Dean Oliver Opponent Four Factor Rating = ((0.4*OppeFG%)-(0.25*OppTOV)+(0.2*OppOREB)+(0.15*OppFTR))
Dean Oliver Net Four Factor Rating = DO Team FF Rating – DO Opp FF Rating
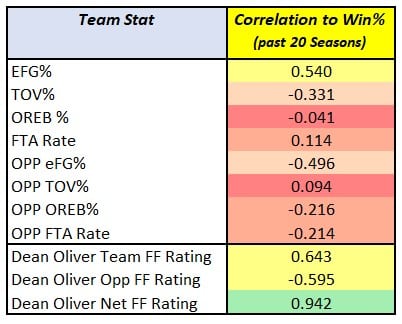
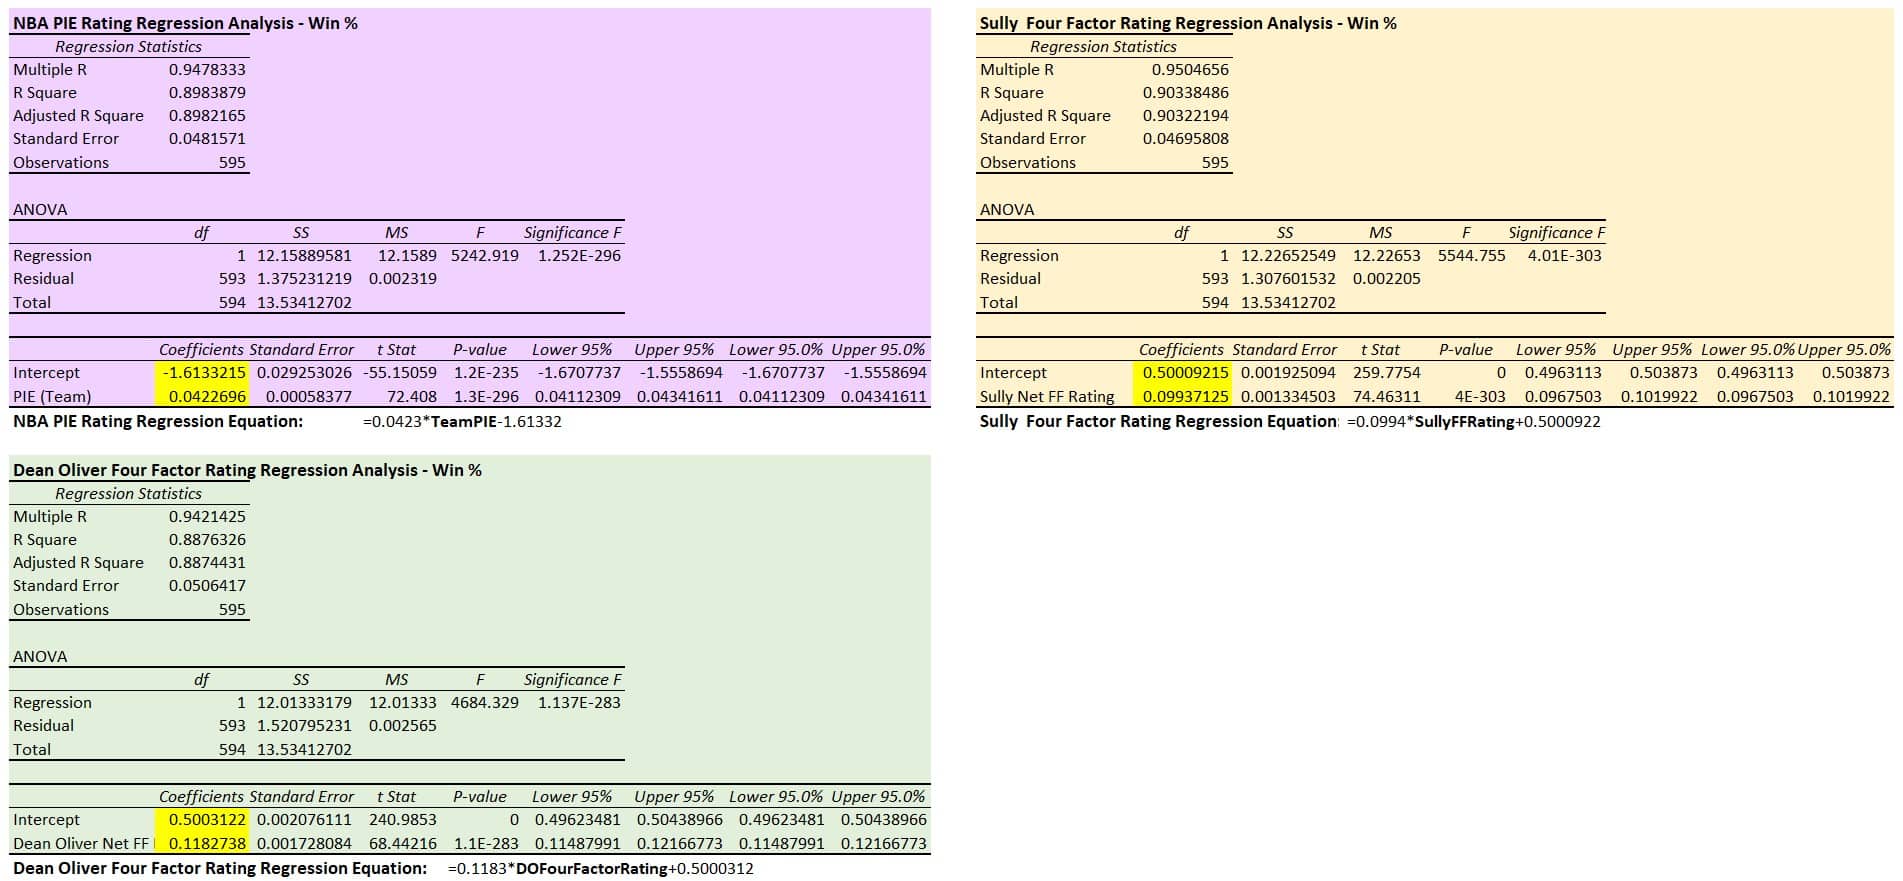
I plugged the newly assembled Dean Oliver Four Factor Rating into the correlation analysis and got the following results:
When observed together, Dean Oliver’s Four Factors have a much stronger correlation to Win % than any of the factors by themselves! I don’t know how it’s possible that 8 stats so loosely related to winning, become an incredible correlation to success when merged together – at first it seemed like magic to me.
But magic or not, Dean’s rating still doesn’t beat the NBA’s Team PIE rating.
Further Analysis – Sully’s Four Factors
I didn’t like the idea of the NBA’s own statistic reigning supreme so I wanted to see if I could make my own advanced statistic. Why? Because I am a petty man. I once analyzed Charles Barkley’s fat-shaming of San Antonio’s women just to prove it was out of resentment for his own indiscretions.
I didn’t begin this under the pretension of successfully creating a viable and competitive advanced statistic of my own. I simply wanted to make my number bigger than theirs. And I did.
I used the model developed earlier for Dean Oliver’s Four Factor Rating and relied on that good ‘ole analytics technique, trial and error. After tweaking the different weightings several times, I found one mix that had both a strong correlation and made sense in basketball terms.
Sully’s Team Four Factor Rating = ((0.50*eFG%)-(0.30*TOV)+(0.15*OREB)+(0.05*FTR))
Sully’s Opponent Four Factor Rating = ((0.50*OppeFG%)-(0.30*OppTOV)+(0.15*OppOREB)+(0.05*OppFTR))
Sully’s Net Four Factor Rating = Sully Team FF Rating – Sully Opp FF Rating
What I initially thought would just be a good laugh, ended up being a total game-changer. Over the past 20 NBA Seasons, my “Sully Four Factor Rating” has a stronger correlation to Win % than both the NBA’s PIE rating and Dean Oliver’s Four Factor Rating.

I couldn’t believe it at first. I re-did the calculations three times just to make sure they were right.
After considering the various possibilities, I believe my new Four Factor Rating is more accurate, not because I am a mathematical genius, but because the weights I stumbled upon happen to coincide perfectly with the evolution of the sport.
Think about it: Dean Oliver developed his Four Factors in 2002. His analysis probably used stats from the ‘80s and ‘90s; but the game has changed drastically since then! The “3-Point Revolution” and the death of the traditional big man are just a couple factors that might explain why my updated four factor stat is more relevant.

And, a little bit of research further backs that notion. Between 1980 and today, league-wide Free Throw Attempts per game have declined 27% while Offensive Rebounds per game have declined 33%.
Furthermore, league-wide 3-Point Attempts per game have increased 120% since just the year 2000. The Sully Four Factor Rating essentially took Dean Oliver’s model and updated the weightings for the 21st century – more weight to Shooting Efficiency and less weight to Rebounding and Free Throws. Considering how the league has fundamentally changed over the years, my updates to the four factors are almost intuitive.
But, the past is the past. How strong are these statistics when applied to the “current” NBA season?
The Test – Predicting 2020 Wins (NBA vs Dean vs Sully)
When testing the statistics against the past 20 NBA seasons, the Sully Four Factor Rating showed the strongest correlation. But let’s see what happens when we apply those models to the 2019-2020 NBA season… which one most accurately predicts Team Wins?
Click on images to enlarge
Without getting too far into the statistical weeds, I’ll quickly walk you through what I did to calculate the 2020 predicted wins.
I first ran an independent regression analysis on each of the three advanced stats, identified the coefficient/intercept, and then plugged those values into the regression equation (y=b0+x1*b1). In all honesty, I don’t really know how this part works. But when plugging in the associated Team stat, the predicted Win % comes out!
For example, this year Milwaukee had a Sully Four Factor Rating of 3.43. Plugged into the equation:
- Bucks 2020 Predicted Win % = 1183*3.43+.5000312 = .840 Win %
Multiplied by the number of games played during the season:
- Bucks 2020 Predicted Wins = .840* 65 = 55 Wins
Compared to the Bucks 2020 Actuals of .815 Win % and 53 Wins, the model appears to be holding!
I just extrapolated this for each of the three statistics, for every 2020 team, and boom…
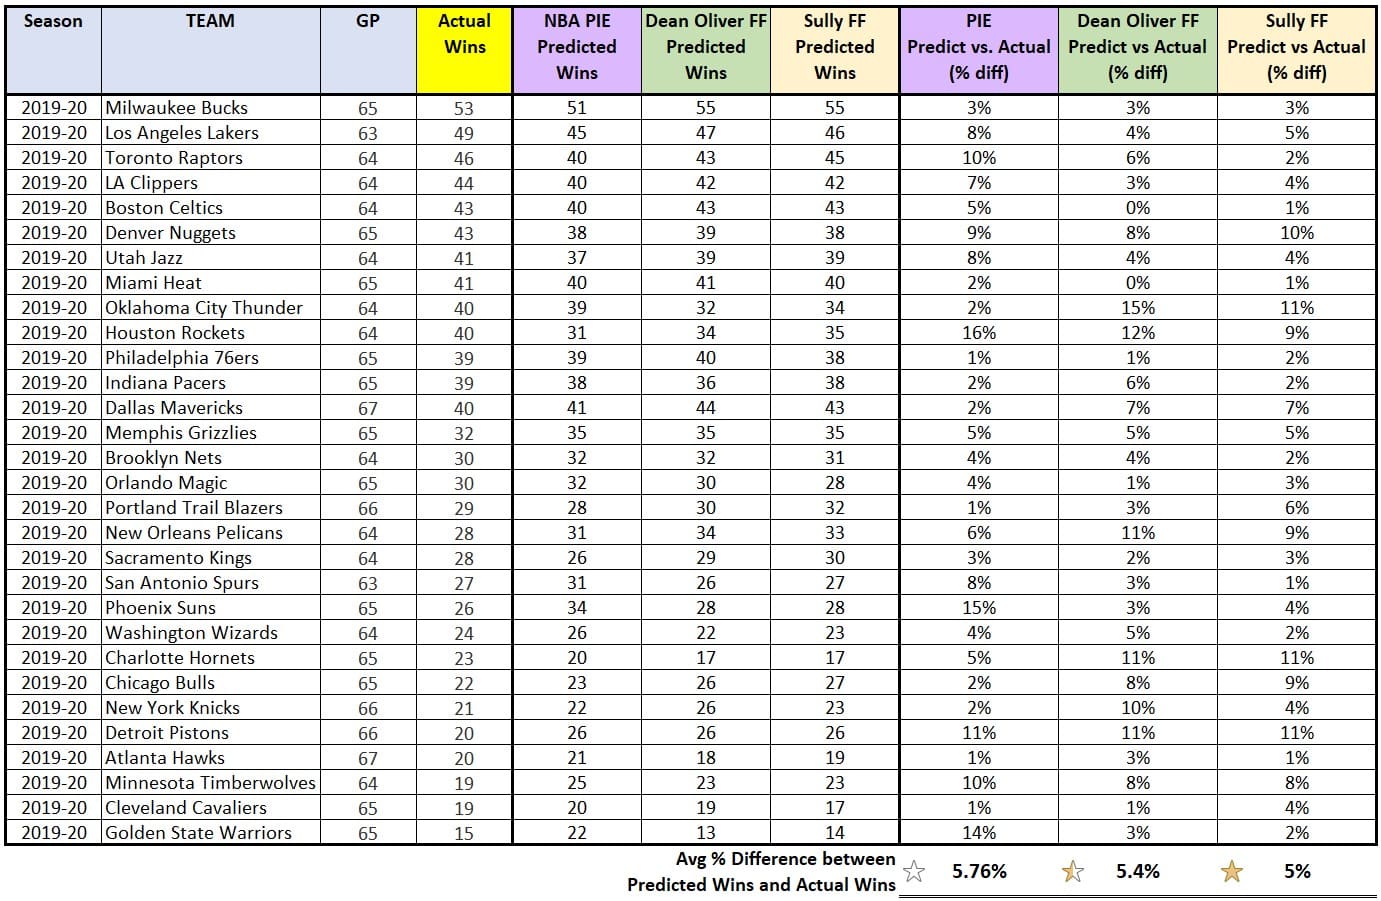
The Sully Four Factor Rating is able to predict Team Wins with over 95% accuracy. At nearly a full point better than the NBA’s PIE rating and a half-point better than Dean Oliver’s Four Factor Rating, I win again!
An interesting result from this exercise is that my Houston Rockets, the “Morey-ballers” as I like to call them, skewed the predictive models more than any other team! How does the team, whose on-court identity is indistinguishable from a spreadsheet, be the one most distorted by the statistical models?!
Other observations:
- Worst Team in the League according to each model:
- NBA PIE Rating: CLE – predicted 20 Wins (vs 19 Actual)
- Dean Oliver FF Rating: GSW – predicted 13 Wins (vs 15 Actual)
- Sully Four Factor Rating: GSW – predicted 14 Wins (vs 15 Actual)
- The Least Predictive Teams for each model (team with largest variance %):
- NBA PIE Rating: HOU -9 Wins (16% off)
- Dean Oliver FF Rating: OKC -8 Wins (15% off)
- Sully Four Factor Rating: DET -6 Wins (11% off)
- Dean Oliver’s Four Factor Rating was less predictive of the Wizards (the very team he coaches) than the Sully Four Factor Rating.
- In real life, the Wizards won 24 games this year; the Sully FF Rating predicted 23.0 Wins while Dean Oliver’s FF Rating predicted 21.6 Wins.
- Get your shit together, Dean.
The NBA’s Most Valuable Statistic award goes to…
Me motherfuckers, have you even been reading?!

Out of all the 70+ statistics analyzed, the Sully Four Factor Rating had the strongest correlation to Team Win % for the past 20 NBA seasons while also demonstrating the highest predictive accuracy when applied to the 2020 season.
Suck it NBA. Suck it Doctor Oliver. I win.
Now gimme my ball, I’m going to watch Tiger King.
As always, here is the link to all my research!
RELATED
My NBA Reddit Post That Went Viral: James Harden’s Road Play with City’s Strip Club Quality Analysis
Charles Barkley’s Secret: A Critical Analysis